About the Speed Charts
The speed charts are dynamically generated using speed average data from the Houston TranStar Traffic Monitoring System. They can be used to compare historical speed averages with the current day's speeds and view trends.
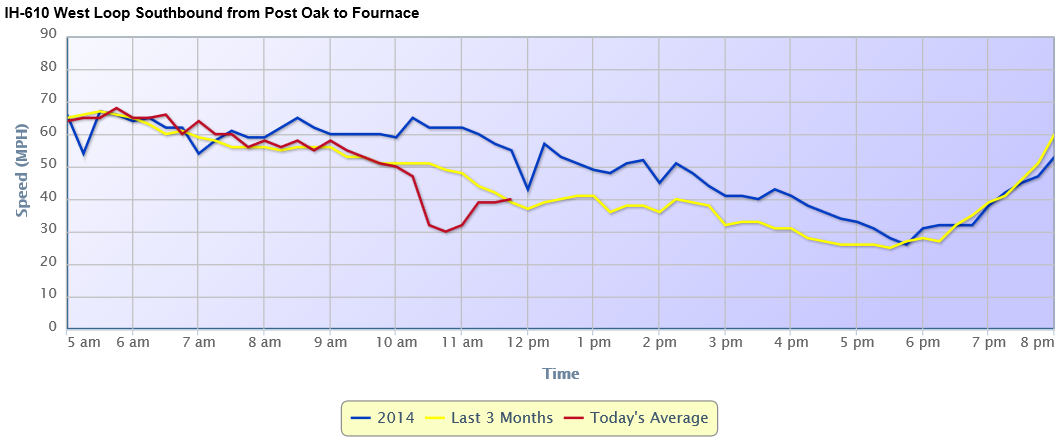
Each chart plots lines representing typical traffic speed averages on a freeway segment between 5 AM and 8 PM each weekday. The averages are calculated using historical data from the system. The most recent historical data is the average of the last 3 months and is updated each day. Full year averages all also available for viewing. Historical data always consists of data from the current day of week. So, if you are looking at the speed charts on a Monday, the historical data is an average of all the Mondays for the specified interval. A sample speed chart is shown below.
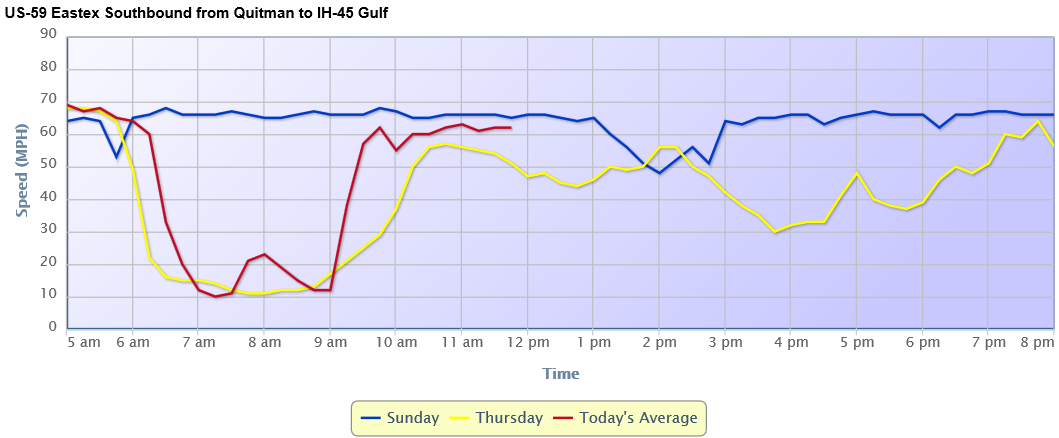
Traffic speeds tend to vary by day of week, so you can also view speed charts that compare each day of the week's historical average to the current day. A sample day of week comparison is shown below.